Measurment of global and human development
Development is an improvement in the quality of life. Although wealth comes into this, many other things are also important like health, education and security.
Indices are an arrangement of material or figures in a numerical order which is useful because organisations and governments can use them to decide where investment and improvements are most needed. We can use them to compare countries. For example, if a country has very high birth rates then the government may need to invest in family planning.
Gross domestic product (GDP) is the total value of all goods and services produced domestically inside a country by a nation during a year.
Gross national product (GNP) is the total market value of all goods and services by a nation during a year. It includes the value of goods and services produced overseas.
Gross national income (GNI) is the total value of goods and services produced within a country together with the balance of income and payments from or to other countries, which is the preferred monetary indicator.
Balance of trade is the difference between visible/physical and books imports and exports.
Balance of payments is the difference between visible/physical and books, banking, insurance and remittances exports and imports. If the country has a balance of payments deficit, we sometimes say that the country is in the red. If a country has surplus we sometimes describe that country as being in the black.
Monetary is relating to financial or money matters.
A quarter is a unit used for quoting GDP. A quarter is simply a three month period and a year is sometimes quoted as being per annum.
Problems with monetary measures
• Most countries use different currencies, because the value of currencies change against each other (exchange rates) it is hard to make accurate comparisons.
• All countries have a formal and an informal economy. The formal economy is regulated by the government and its value is known. However, the informal economy (shoe shining, car windscreen cleaning etc.) aren’t so therefore neither government nor economists know the true value of economies and GNI.
• Some goods and services are unpaid e.g. volunteering in a charity shop or parenting. However, they contribute to the economy so shouldn’t they be included?
• Looking at a country’s overall GNI disguises intra-country variations. For example the East of China is becoming very rich, but much of the west is still very poor.
• Just looking at money also neglects many other important aspects of development e.g. education and healthcare.
Per capita: Because countries have different size populations, it is not fair comparing their total GNI (countries with bigger populations will normally have larger GNI). Therefore, economists and geographers normally look at GNI (or GDP/GNP) per capita. To calculate GNI per capita you take the total GNI of a country and divide it by the total population.
Human development index (HDI) was developed in 1990 and is used by the United Nations to measure levels of development, HDI looks at three variables:
• GNI per capita
• Life expectancy
• Comparing expected years of schooling for current school children and mean years of schooling for adults age 25 (the old system just looked at adult literacy)
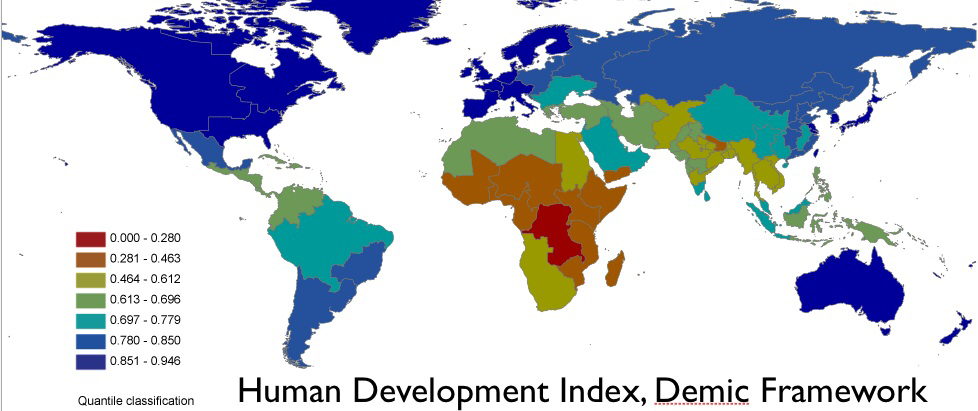
The HDI calculations score all countries between 0 and 1. The map below shows that according to HDI the most developed countries are in Western Europe North America and Australia while the least developed countries are in Central Africa. HDI is what is known as a composite measure. This simply mean that more than one variable is taken into account, for HDI three variables are looked at. It can be harder to collect all the data for composite measures, but they do give a more complete and accurate picture of a country’s are area’s development.
• GNI per capita
• Life expectancy
• Comparing expected years of schooling for current school children and mean years of schooling for adults age 25 (the old system just looked at adult literacy)
The HDI calculations score all countries between 0 and 1. The map below shows that according to HDI the most developed countries are in Western Europe North America and Australia while the least developed countries are in Central Africa. HDI is what is known as a composite measure. This simply mean that more than one variable is taken into account, for HDI three variables are looked at. It can be harder to collect all the data for composite measures, but they do give a more complete and accurate picture of a country’s are area’s development.
Advantages of HDI
• Composite indicator containing three elements. Better than just looking at money.
• It allows comparison between regions and countries
Has been existence since so allows temporal changes
• Allows for analysis of different components
Disadvantages of HDI
• Does not take into account environmental factors e.g. China
• Data could be unreliable, incomplete or unavailable
• It is an average and does not show internal disparities
• Does not measure factors like human rights, gender and corruption
• Literacy measurement changed in 2011 so may make literacy comparisons harder.
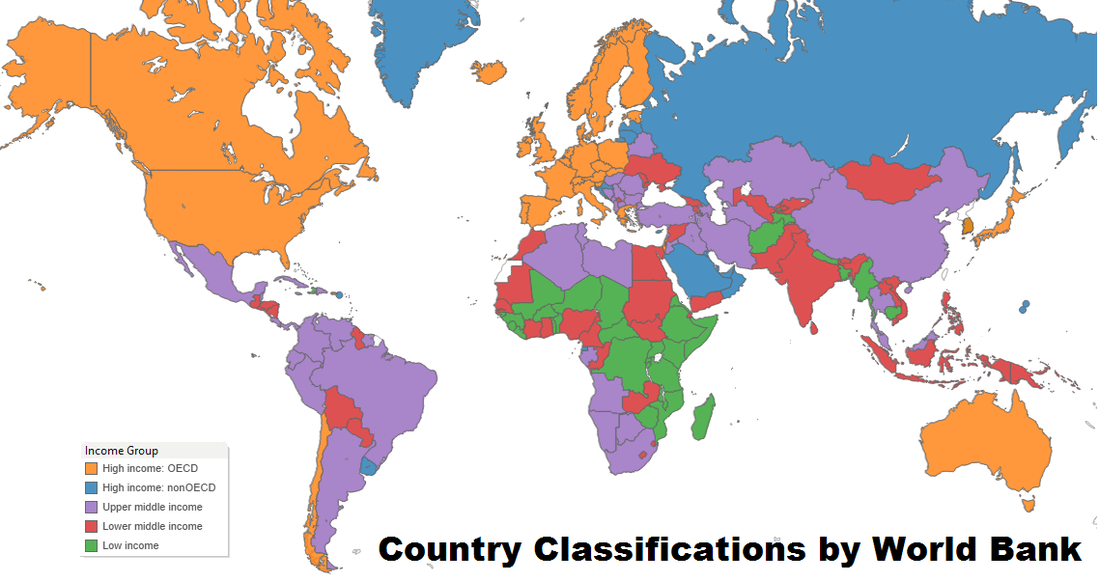
Many terms are now used to describe countries at different stages of development, some of the most common are – More economically developed country (MEDC): A developed country, where the tertiary sector is probably the most important sector of the economy. (HIC – High income country) Less economically developed country (LEDC): A poorer country where the most important sector of the economy is probably the primary sector. (LIC – Low income country) Newly industrialising country (NIC): A developing country where the most important sector of the economy is within the secondary sector.
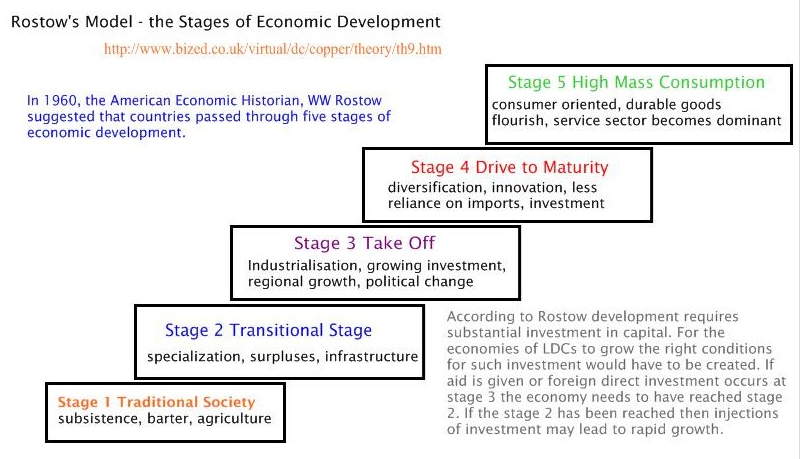
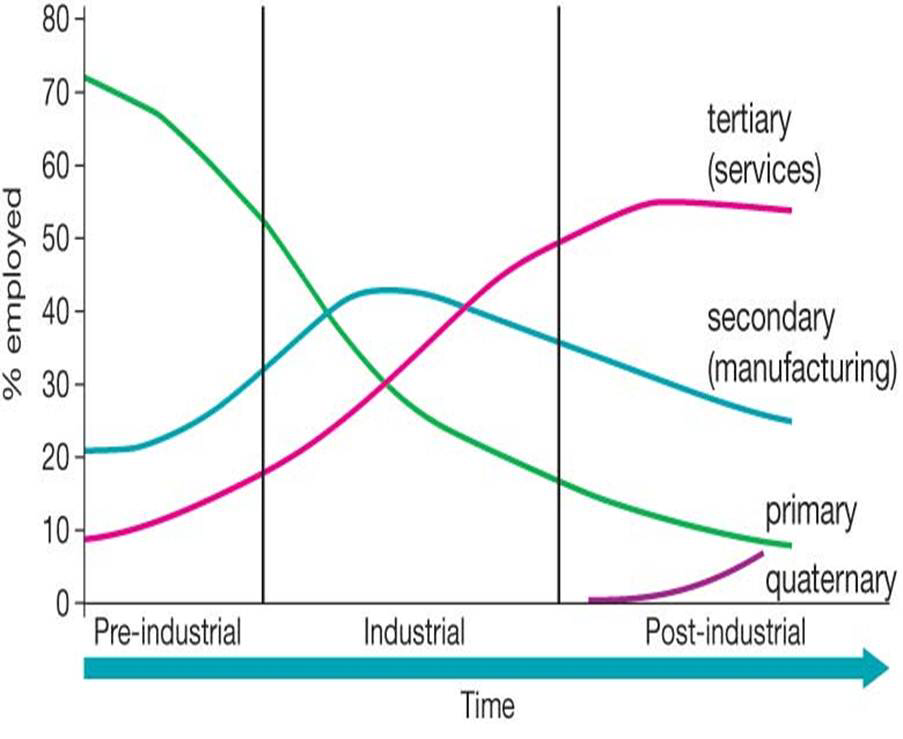
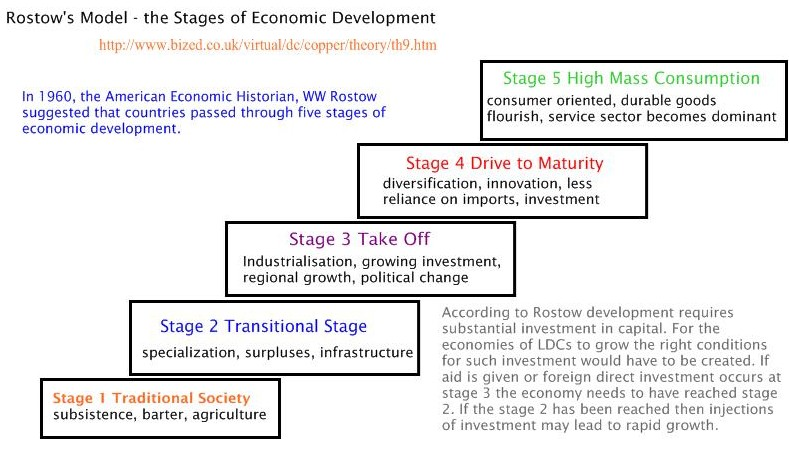
All countries go through different stages of development. The Rostow Model attempts to show these stages. It states that all societies and countries started off being primary based (mainly farmers). Overtime countries may specialise in agricultural products that the physical geography of the area favours. With money earned from selling their products they will be able to invest in infrastructure and start to grow their industry (secondary sector). Again they may specialise in certain industries making more money. As companies and individuals become wealthier they may demand more services growing the tertiary sector.
Primary sector: The sector of the economy using the land to harvest, mine or grow things e.g. forestry, farming and mining.
Secondary sector: The sector concerned with making things from raw materials e.g. construction and manufacturing.
Tertiary sector: The sector that provides a service e.g. teachers, doctors, hoteliers and hairdressers.
Quaternary sector: The knowledge based sector of the economy e.g. IT, consultation and R&D.
Countries at similar levels of development have grouped themselves together in organisations to discuss development and economic policy. A couple are: Brazil, Russia, India, China and South Africa (BRICS): These five countries have some of the fastest growing economies in the world, they are sometimes called the emerging markets. They have formed a group/organisation to discuss development strategies and economic policy.
The Group of Twenty (G20) is a group of the World’s twenty biggest economies (it includes the EU as an economic union). They meet regularly to discuss economic policy
Marginalisation: When a group of people become separated from society.
Polarisation: This is when there is a massive division between two groups. For example a country might become polarised economically if the rich become richer and the poor become poorer.
ECONOMIC INDICATORS
Internet connectivity: The percentage of people connected to the internet.
Mobile ownership: The amount of people who own mobile phones.
GDP/GNP/GNI per capita: The amount of money made by a country divided by its population. See above for specific explanations.
Unemployment Rate: The percentage of people who do not have a job. Sometimes economists look at long term unemployed or unemployment amongst different age groups.
Debt Ratio: The amount of money a country owes in relation to its GDP.
Economic freedom index: An indices that looks at individuals and companies freedom to work, hire, invest, borrow, lend, produce and consume in the manner they chose.
Car ownership: The percentage of people that own cars.
Income: The average income of countries
Home ownership: The percentage of people that own their own homes.
Doctors: The number of doctors per 100,000 of population.
SOCIAL INDICATORS
Birth rates: The number of births per 1000 of population per year.
Death rates: the number of deaths per 1000 of population per year.
Infant mortality: The number of deaths before the age of one per 1000 live births per year.
Child mortality: The number of deaths before the age of five per 1000 live births per year.
Life expectancy: The average that someone is expected to live from birth with a country or region.
Total fertility rate: The average number of children a female is expected to have in her lifetime.
Murder Rate: The number of murders per 100,000 of population per year
Adult literacy: The percentage of adults who can read and write.
School enrolment: The percentage of people that enrol in primary school or complete primary/secondary school.
University graduates: The percentage of people who start university or the percentage of people who complete university courses.
Calorific Intake: The average number of calories consumed by different age groups.
Malnutrition rate: The percentage of children underweight or under height for their age.
ENVIRONMENTAL INDICATORS
Forest Cover: The percentage of land covered in forest.
Areas Protected: The percentage of land that is officially protected i.e. National Parks or Reserves.
Pollution levels: the amount of different pollutants in the land, water or atmosphere.
Biodiversity: The variety of plants and animals within a country.
Endangered Species: The number of species that are endangered within a country.
Infant Mortality
Reducing infant mortality is a Millennium Development Goal (number four). Despite this there are still huge differences in the rates of infant mortality around the world as in many LEDCs birth certificates and death certificates are not always given and many births take place outside of hospitals. Infant mortality rates can be high for a number of reasons including:
• The health of the mother
• Natural care
• Education levels
• Diet
• Disease
• Conflict
• Access to healthcare and medication
Education
Achieving universal primary education is a Millennium Development Goal (number two). Education can be measured in countless ways including; adult literacy, student teacher ratio, school enrolment, number of school years completed and number of university graduates. When looking at education it is important to look at the education received by boys and girls.
Achieving universal primary education is a Millennium Development Goal (number two). Education can be measured in countless ways including; adult literacy, student teacher ratio, school enrolment, number of school years completed and number of university graduates. When looking at education it is important to look at the education received by boys and girls.
Nourishment
Eradicating extreme poverty and hunger is a Millennium Development Goal (number one). Nourishment is an important indicator because it can affect a person’s ability to work, get educated and fight disease. Even though Malthus predicted that we would run out of food and have mass famines and conflicts over food, there is currently enough food for everyone. However, food is distributed unevenly causing problems.
Eradicating extreme poverty and hunger is a Millennium Development Goal (number one). Nourishment is an important indicator because it can affect a person’s ability to work, get educated and fight disease. Even though Malthus predicted that we would run out of food and have mass famines and conflicts over food, there is currently enough food for everyone. However, food is distributed unevenly causing problems.
Problems and Limitations of Development Indicators
Although development indicators can be useful for governments, NGO’s etc. to know where to target investment or where for industries to locate a new factory, or even for where an individual to move to, they do have their limitation. These limitations include:
• Countrywide statistics disguise intra-country variations. If you look at a map of China, the east of China is a lot richer than the west, but if you looked at China’s overall GDP you would not know this.
• In many countries data is inaccurate or incomplete. Some countries also refuse to release certain pieces of information or data.
• Most development indicators (with the exception of HDI) focus on only one aspect of development.
• Most indicators use averages and tend to neglect or highlight the sectors of the population that are marginalised.
• Indicators are always out of date. Once information has been collected, analysed, presented and published a lot of things can have changed either for the better or worse.
• Development indicators can be manipulated, used or ignored to suit people’s needs. One indicator may suggest an area is developed while another may suggest an area is undeveloped.
Origin of disparities
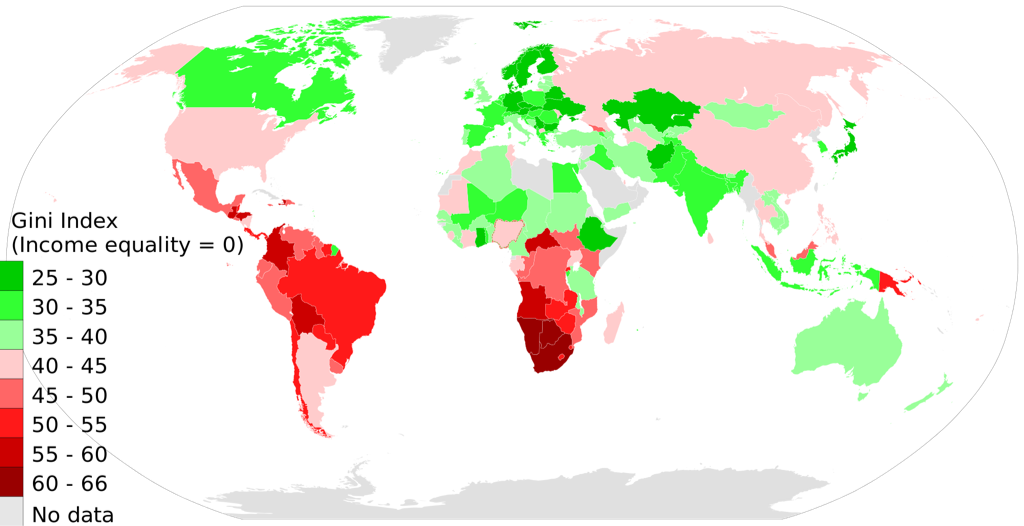
- Gini coefficient is a technique frequently used to show the extent of income inequality which allows analysis of changes in income inequality over time in individual countries and comparison between countries.
A low value indicates a more equal income distribution while a high value shows more unequal income distribution. A Gini coefficient of zero would mean that everyone in a country had exactly the same income which is a perfect inequality (0.232 in Denmark to 0.707 in Namibia).
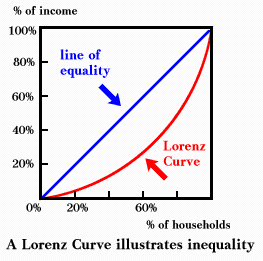
The Lorenz curve is a graphical technique that shows the degree of inequality that exists between two variables. It is often used to show the extent of income inequality in a population. The diagonal line represents perfect equality in income distribution. The further the curve is away from the diagonal line the grater the degree of income inequality.
Theory of regional disparities
- Cumulative causation theory contains three stages:
- The pre-industrial stage when regional differences are minimal
- A period of rapid economic growth characterised by increasing regional economic divergence
- A stage of regional economic convergence when the significant wealth generated in the most affluent regions spreads to other parts of the country
Factors affecting internal disparities
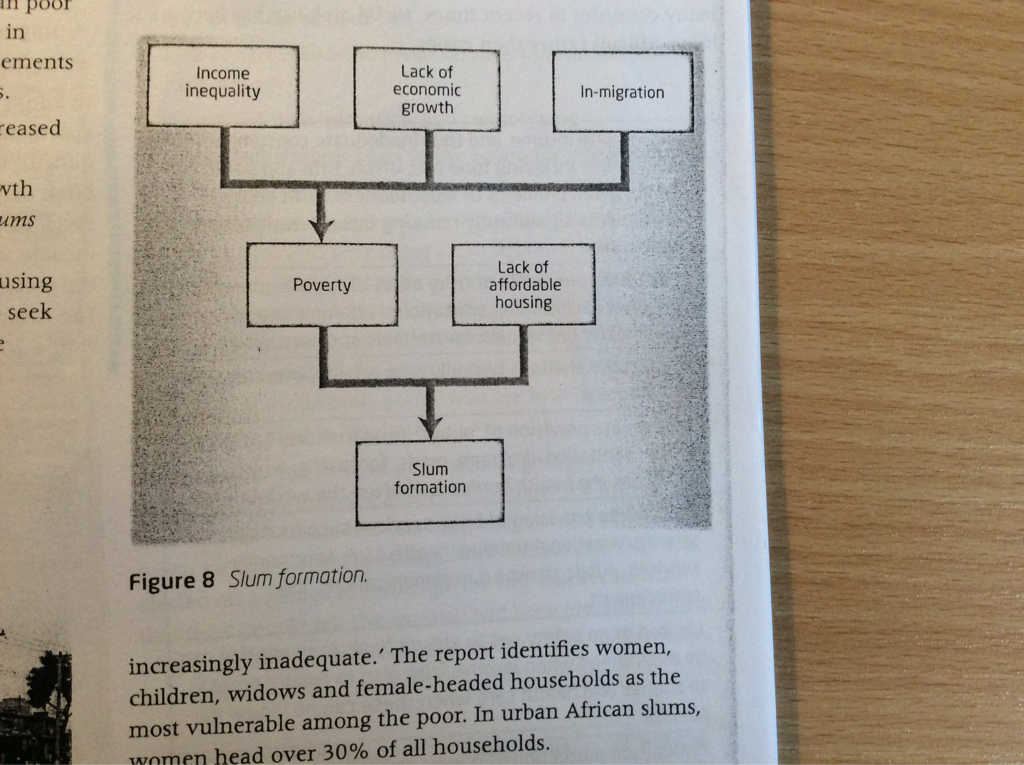
32% of the world's urban population - almost 1 billion people - are housed in slums.
A slum is a heavily populated urban area characterised by substandard housing and squalor. However, all large cities in developed countries also contain slum districts. The UN recognises that the focus of global poverty is moving from rural to urban areas, a process known as the urbanisation of poverty. Without significant global action the number of slum dwellers will doible over the next 30 years.
- Regional differences within countries
- Urban/rural disparities
- Intra-urban contrasts
32% of the world's urban population - almost 1 billion people - are housed in slums.
A slum is a heavily populated urban area characterised by substandard housing and squalor. However, all large cities in developed countries also contain slum districts. The UN recognises that the focus of global poverty is moving from rural to urban areas, a process known as the urbanisation of poverty. Without significant global action the number of slum dwellers will doible over the next 30 years.
Ethnicity and employment
The development gap often has an ethnic or religious dimensions whereby ethnic groups in a population have income levels significantly below the dominant groups in the same population. This is invariably the result of discrimination which limits the economic, social and political opportunities available to the disadvantaged groups. Because of such obvious differences in status, tensions can arise between majority and minority groups resulting in:
The formal and informal sectors of emplyment
Jobs in the formal sector will be known to the government department responsible for taxation providing better pay and security. In addition, holiday and sick pay may be included. For example, education service workers, government workers, people working in established manufacturing and retail companies.
Jobs in the informal sector that operates outside official recognition avoiding taxes therefore low payment and temporary or part-time jobs are only included, job security will be poor. For example, shoe-shinners, street food stalls, messengers, repair hops and market traders. Therefore, bazaars and street markets are popular places of selling goods from the informal sector.
Education
It is a key factor in explaining disparities within countries. Higher levels of educations links with better-paid employment. In developing countries there is a link between education levels and family size. People with higher education have smaller families and are thus able to save and invest more for the future.
Land ownership (tendure)
The distribution of land ownership has had a major impact on disparities in many countries. The greatest disparities tend to occur alonside the largest inequality in land ownersgip. The ownership of even a very small plot of land provides a certain level of security than those in the countryside without land cannot possibly aspire to.
The development gap often has an ethnic or religious dimensions whereby ethnic groups in a population have income levels significantly below the dominant groups in the same population. This is invariably the result of discrimination which limits the economic, social and political opportunities available to the disadvantaged groups. Because of such obvious differences in status, tensions can arise between majority and minority groups resulting in:
- Social unrest
- Migration
- New political movements
The formal and informal sectors of emplyment
Jobs in the formal sector will be known to the government department responsible for taxation providing better pay and security. In addition, holiday and sick pay may be included. For example, education service workers, government workers, people working in established manufacturing and retail companies.
Jobs in the informal sector that operates outside official recognition avoiding taxes therefore low payment and temporary or part-time jobs are only included, job security will be poor. For example, shoe-shinners, street food stalls, messengers, repair hops and market traders. Therefore, bazaars and street markets are popular places of selling goods from the informal sector.
Education
It is a key factor in explaining disparities within countries. Higher levels of educations links with better-paid employment. In developing countries there is a link between education levels and family size. People with higher education have smaller families and are thus able to save and invest more for the future.
Land ownership (tendure)
The distribution of land ownership has had a major impact on disparities in many countries. The greatest disparities tend to occur alonside the largest inequality in land ownersgip. The ownership of even a very small plot of land provides a certain level of security than those in the countryside without land cannot possibly aspire to.
General Facts
Geographical Facts
Capitals
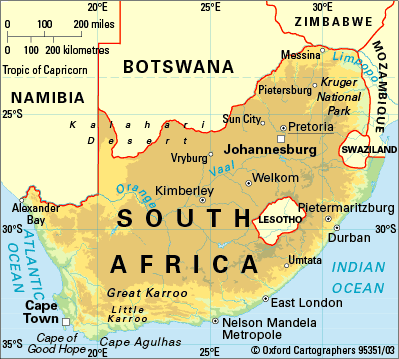
- Official name: Republic of South Africa
- Form of state: A federal state, comprising a national government and nine provincial governments.
- Population (Census 2011): 51.77-million
- Currency: Rand (R)
- Time: Two hours ahead of GMT
Geographical Facts
- Area: 1 219 090 square kilometres
- Agriculture: 81.6% of total land area
- Arable land: 12.1% of total
- Irrigated land: 10.15% of arable land
Capitals
- Pretoria (administrative)
- Cape Town (legislative)
- Bloemfontein (judicial)
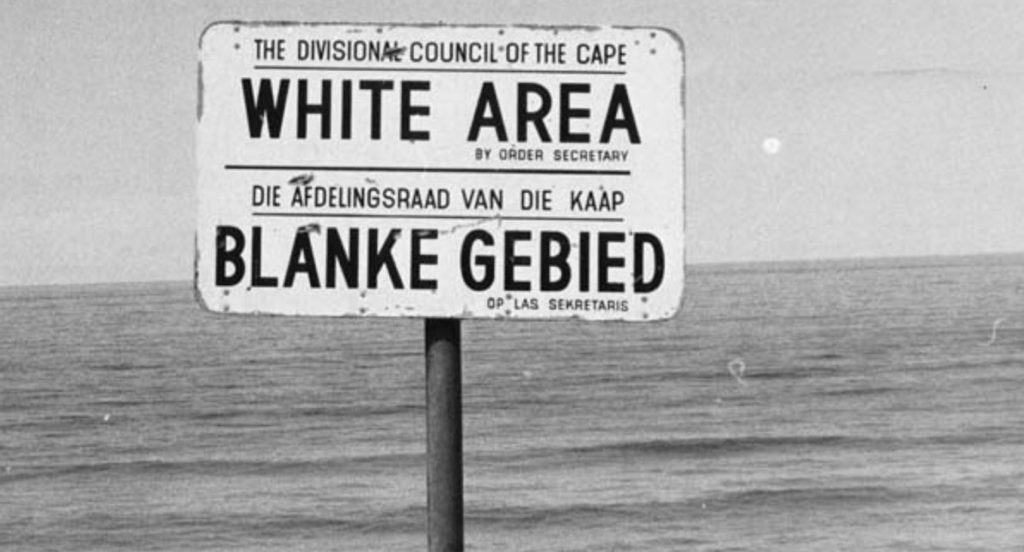
Apartheid and the beginnings of inequality and disparity – the issue of race and ethnicity
- Landownership and residence: the been a cornerstone of the apartheid system. From its onset segregation (apartheid) dominated the philosophy and separate areas for whites and blacks were put into place.
- Land reform has taken place in the post-apartheid era (Land reform) however much of it has not been in a peaceful manner – South Africa's land reform.
- Much of the land reform has not been peaceful – “In South Africa, more than 4,000 farmers have been murdered since the end of apartheid, with estimates suggesting a murder rate for commercial farmers four times the national average. Many farmers perceive the attacks to be racially motivated.”

Absolute Poverty: When people don’t have enough money to afford their daily needs. The UN usually classifies anyone earning less than $1 or $2 to be absolutely poor.
Relative Poverty: When people have less than the average in the community or country that they live in. For example someone would be considered relatively poor if everyone in their community can afford a car, television and a computer, but they cannot.
Income gap: The income gap between the richest and poorest in a country.
Polarisation: When a country or area becomes divided. One half become richer, while the other half becomes poorer.
Inequalities or Disparities: When there is a difference in the way people are treated or paid or there is a difference in the amount of money and possessions they own.
Marginalisation: The process of an individual or group of people becoming separated from the majority. People may become marginalised because of their age, race, religion, economic status.
Needs: Things that people need to survive. Needs include water, food, shelter and clothing.
Formal Economy: The sector of the economy that is taxed, monitored and regulated by the government. The formal economy is included in a country’s GDP, GNP and GNI.
Informal Economy: The sector of the economy that is not taxed, monitored or regulated by the government, it is sometimes referred to as the black market. The informal economy includes illegal activities like the drugs and sex industry, but also begging, show shining on the street or selling counterfeit DVDs.
Unemployment: When people don’t have job.
Underemployment: When people are employed in a job below the skill/education level they are qualified for. For example a trained doctor working as a security guard.
Benefits/Welfare: Money provided by the government to people that are unemployed, unable to work or earning a salary below the poverty line.
Distribution: The way things are spread out. You might describe how a population is spread out or how the income within a population is spread out.
Analysing disparities and change
'Dependency Theory’ ideas were popularised by Andre Gunder Frank in 1971. Frank carried out historical investigations to try and ascertain why some areas of the world were developed and other areas undeveloped by:
- The development of the rich world was achieved by exploitation of the developing world.
- That developing countries moved into production of cash crops (coffee, tea, cocoa) which meant that they were no longer subsistent and actually dependent on developed countries for food imports and food aid.
- That the development of many countries were slowed or stopped by the arrival of colonists. He points out that many countries were richer before colonisation than after.
- Many poor countries owe large debts to developed countries or international banks
- The world is now more globalised with many developed country TNCs operating in and possibly exploiting developing countries.
- Developed countries tend to specialise in more value added industries like banking and manufacturing, widening the development gap even more. This can increase debt and hamper independence and technological development of the periphery,
- Many international organisations are dominated by developed countries for example G20, World Bank, IMF and the UN Security Council
- Many developing countries have now become reliant on NGO help
- Population growth is highest in developing countries so many are suffering from greater overpopulation and are more dependent on foreign help.
The Rostow model states that all countries are at different stages of development on the path to the stage 5 – mass consumption stage 5. Rostow model suggests that any country in the lower levels are going to be less developed in terms of infrastructure, service provision, income, etc. when compared to a country in a higher stage. Like all Models, the Rostow Model is very simplistic and has been criticised for a number of reasons, including:
- Many countries seemed to have become stuck at stages and can’t move onto to stage 4 and 5.
- Developed countries only reached stage 5 by exploiting countries, now making it impossible for poorer countries to develop further
- High levels of debt and corruption mean some countries struggle to progress
- It is probably not possible for all countries to enjoy mass consumption. Some countries will need to specialise in primary products to satisfy our demand for food and raw materials. Because jobs in primary industries are less well paid, it will probably mean that they are as wealthy and cannot enjoy a mass consumption lifestyle.
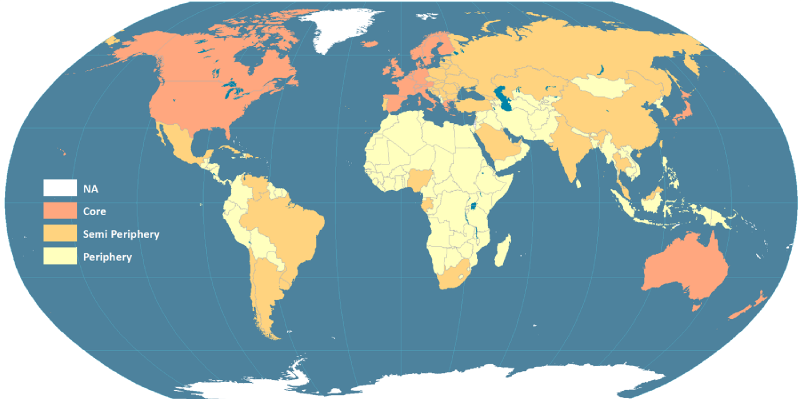
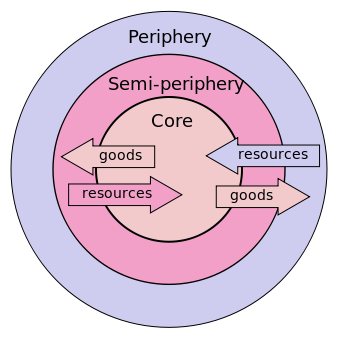
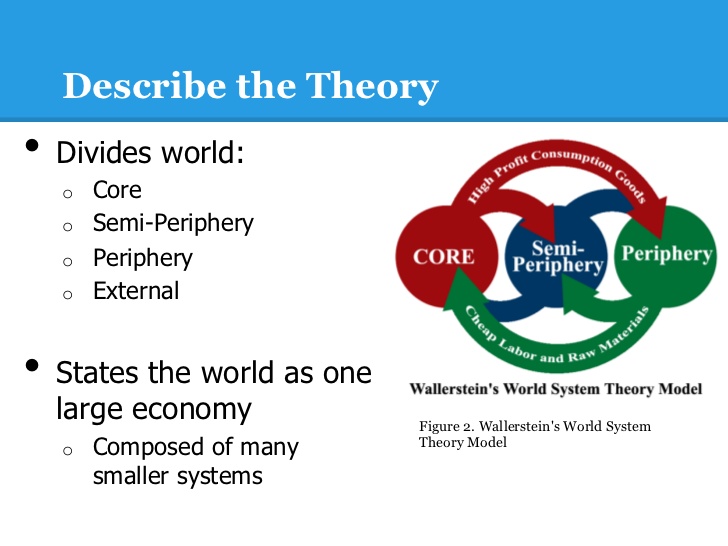
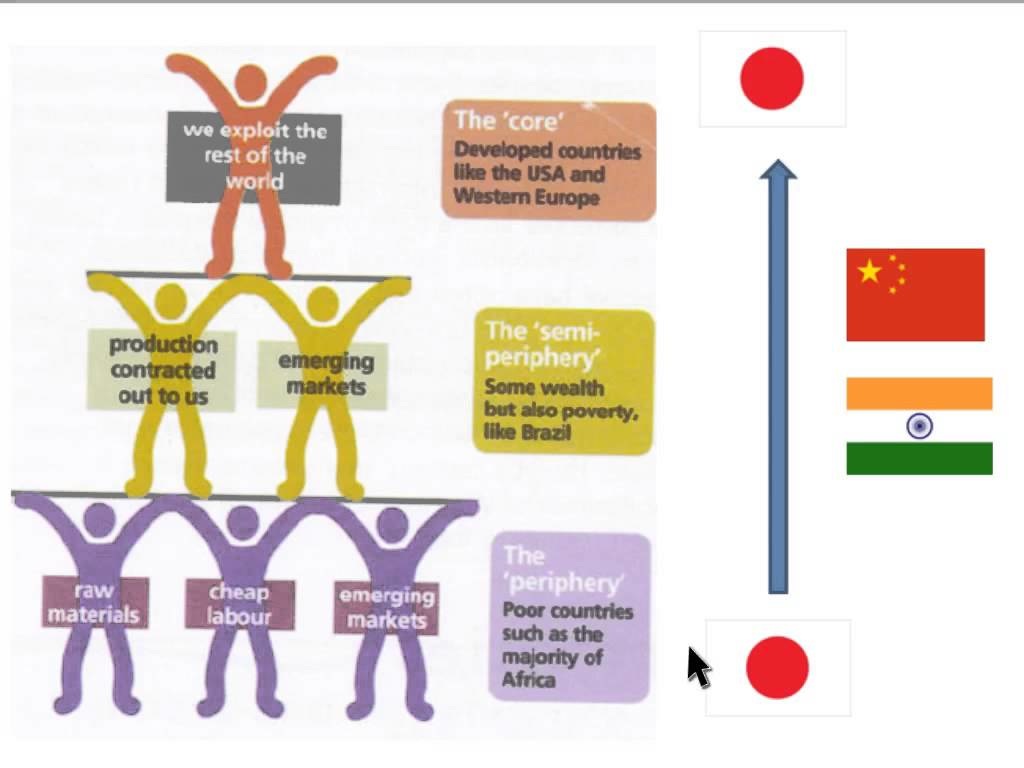
Developed by Wallerstein in the 1970’s, Wallersteins theory argues that a capitalist world economy is a fairly new idea that has only been in existence since the 16th Century. He stated that a number of countries forged ahead creating a core region with the result of the world being peripheral. He then stated that a semi-peripheral area then developed to bridge the gap between the two. He said the periphery became specialist in the primary sector while the core became specialist in the higher value secondary and tertiary sectors. World System theory doesn’t state that countries become stuck in the periphery like dependency theory, but can develop and therefore reduce disparities. NICs and the BRICS countries are good example of semi-peripheral countries fast reducing the disparities between the have and the have not’s.
Millenium Development Goals (MDGs)
The Millennium Development Goals are eight international goals that all members of the United Nations agreed to try and meet by 2015. The aim of the MDGs are to encourage economic and social development in all countries (especially LEDCs). The eight Millennium Goals are:
I will be looking at three of them in order to understand the attempts and successes in meeting their targets, namely:
- Poverty Reduction
- Education
- Health
Poverty Reduction
The eradication of extreme poverty and hunger is Millennium Development Goal number one. Goal number one is basically two interlinked targets (Target 1. Halve, between 1990 and 2015, the proportion of people whose income is less than $1 a day and Target 2. Halve, between 1990 and 2015, the proportion of people who suffer from hunger). Their success will be measured by: Indicators
1. Proportion of population below $1 (1993 PPP) per day (World Bank)
2. Poverty gap ratio [incidence x depth of poverty] (World Bank)
3. Share of poorest quintile in national consumption (World Bank)
4. Prevalence of underweight children under five years of age (UNICEF-WHO)
5. Proportion of population below minimum level of dietary energy consumption (FAO) In terms of poverty the graph to the right indicates that all regions have seen a fall in absolute poverty accept West Africa. However, apart from South East Asia and Eeast Asia no regions have yet met the Millennium Development Goal. Asia has seen a massive fall in poverty because of the massive success of countries like China, India, Singapore, South Korea, Vietnam and Indonesia. However, even though many regions are seeing a fall in absolute poverty, rising food prices actually mean that many people are worse off, despite being above the UN threshold. So even though China and India will probably mean the goal is meant, the growing imbalance between food and resources will probably ensure that millions still go hungry. In terms of hunger, there remains a huge imbalance in the distribution of food. In many developed countries people are malnourished because they are over eating or eating unhealthily, while in many developing countries people will remain undernourished, especially in countries like Somalia where human and physical factors damage food production.
Education
Universal primary education is Millennium Development Goal number two (Target 3. Ensure that, by 2015, children everywhere, boys and girls alike, will be able to complete a full course of primary schooling). Success will be measured by: Indicators
6. Net enrolment ratio in primary education (UNESCO)
7. Proportion of pupils starting grade 1 who reach grade 5 (UNESCO)
8. Literacy rate of 15-24 year-olds (UNESCO) The graph below shows that almost every region (except CEE/CIS – East Europe and former USSR states) has seen an increase in primary enrolment. However, even with the increase in some regions like Sub-Saharan Africa nearly 30% of children are not been educated. Maybe more encouraging is the graph that shows the equality between female and male education is improving. Apart from Oceania and East Asia every region has seen a convergence to equality between males and females. Again, though it can still be argued that even though gap is dropping, it is still too high because 55% of people who receive no education are females. Recent UN research suggests that youth literacy is improving globally. This is important because it shows that they received an education and should allow them to get a better job and higher income and therefore be able to support their children and send them to school.
Health
The improvement of health falls under Millennium Development Goals four, five and six. Goal 4 (Target and Indicators) – Reduce Child Mortality Target 5. Reduce by two-thirds, between 1990 and 2015, the under-five mortality rate. Indicators 13. Under-five mortality rate (UNICEF-WHO) 14. Infant mortality rate (UNICEF-WHO) 15. Proportion of 1 year-old children immunized against measles (UNICEF-WHO) There has been significant success in meeting this goal. All regions of the world have seen a fall in child mortality rates. However, it must be remembered that because some regions have got such high birth rates and fertility rates the absolute number of child deaths has not decreased e.g. Sub-Saharan Africa. It must also be remembered that roughly 21,000 children die every day because of preventable diseases. The decrease has been achieved by:
Goal 5 (Target and Indicators) – Improve Maternal Health Target 6. Reduce by three-quarters, between 1990 and 2015, the maternal mortality ratio Indicators 16. Maternal mortality ratio (UNICEF-WHO) 17. Proportion of births attended by skilled health personnel (UNICEF-WHO) As can be seen from the graph, maternal deaths (death of the mother during pregnancy and birth) are still extremely high in Africa and East Asia and a long way from meeting the Millennium Development Goal target of reducing maternal deaths by two-thirds. The most common form of death is haemorrhaging (bleeding), infections and abortions. To reduce the amount of haemorrhaging and infections more births need to be in hospitals with suitably trained medical staff standing by. To reduce the amount of unsafe abortions, the amount of unwanted pregnancies has to be reduced or abortion clinics better managed and regulated. In many countries abortions are illegal, which forces many women to have so called back-street abortions which are dangerous
Goal 6 (Target and Indicators) – Combat HIV/AIDS, Malaria and other diseases Target 7. Have halted by 2015 and begun to reverse the spread of HIV/AIDS Indicators 18. HIV prevalence among pregnant women aged 15-24 years (UNAIDS-WHO-UNICEF) 19. Condom use rate of the contraceptive prevalence rate (UN Population Division) 19a. Condom use at last high-risk sex (UNICEF-WHO) 19b. Percentage of population aged 15-24 years with comprehensive correct knowledge of HIV/AIDS (UNICEF-WHO) 19c. Contraceptive prevalence rate (UN Population Division) 20. Ratio of school attendance of orphans to school attendance of non-orphans aged 10-14 years (UNICEF-UNAIDS-WHO) Target 8. Have halted by 2015 and begun to reverse the incidence of malaria and other major diseases Indicators 21. Prevalence and death rates associated with malaria (WHO) 22. Proportion of population in malaria-risk areas using effective malaria prevention and treatment measures (UNICEF-WHO) 23. Prevalence and death rates associated with tuberculosis (WHO) 24. Proportion of tuberculosis cases detected and cured under DOTS (internationally recommended TB control strategy) (WHO) As can be seen from the graph to the right even though the overall number of people living with HIV is increasing, the actual number of new cases is decreasing, along with the number of AIDS deaths. However, the news is not all good, because in some regions like Eastern Europe and Central America the number of HIV infections is increasing.
The key to reducing HIV infection rates is to:
The improvement of health falls under Millennium Development Goals four, five and six. Goal 4 (Target and Indicators) – Reduce Child Mortality Target 5. Reduce by two-thirds, between 1990 and 2015, the under-five mortality rate. Indicators 13. Under-five mortality rate (UNICEF-WHO) 14. Infant mortality rate (UNICEF-WHO) 15. Proportion of 1 year-old children immunized against measles (UNICEF-WHO) There has been significant success in meeting this goal. All regions of the world have seen a fall in child mortality rates. However, it must be remembered that because some regions have got such high birth rates and fertility rates the absolute number of child deaths has not decreased e.g. Sub-Saharan Africa. It must also be remembered that roughly 21,000 children die every day because of preventable diseases. The decrease has been achieved by:
- Improving immunisation programmes
- Improving parental education and providing pre and post natal care
- More females giving birth in hospitals or with trained medical staff
- Breast feeding and vitamin supplements
- Insect repellent bed nets.
Goal 5 (Target and Indicators) – Improve Maternal Health Target 6. Reduce by three-quarters, between 1990 and 2015, the maternal mortality ratio Indicators 16. Maternal mortality ratio (UNICEF-WHO) 17. Proportion of births attended by skilled health personnel (UNICEF-WHO) As can be seen from the graph, maternal deaths (death of the mother during pregnancy and birth) are still extremely high in Africa and East Asia and a long way from meeting the Millennium Development Goal target of reducing maternal deaths by two-thirds. The most common form of death is haemorrhaging (bleeding), infections and abortions. To reduce the amount of haemorrhaging and infections more births need to be in hospitals with suitably trained medical staff standing by. To reduce the amount of unsafe abortions, the amount of unwanted pregnancies has to be reduced or abortion clinics better managed and regulated. In many countries abortions are illegal, which forces many women to have so called back-street abortions which are dangerous
Goal 6 (Target and Indicators) – Combat HIV/AIDS, Malaria and other diseases Target 7. Have halted by 2015 and begun to reverse the spread of HIV/AIDS Indicators 18. HIV prevalence among pregnant women aged 15-24 years (UNAIDS-WHO-UNICEF) 19. Condom use rate of the contraceptive prevalence rate (UN Population Division) 19a. Condom use at last high-risk sex (UNICEF-WHO) 19b. Percentage of population aged 15-24 years with comprehensive correct knowledge of HIV/AIDS (UNICEF-WHO) 19c. Contraceptive prevalence rate (UN Population Division) 20. Ratio of school attendance of orphans to school attendance of non-orphans aged 10-14 years (UNICEF-UNAIDS-WHO) Target 8. Have halted by 2015 and begun to reverse the incidence of malaria and other major diseases Indicators 21. Prevalence and death rates associated with malaria (WHO) 22. Proportion of population in malaria-risk areas using effective malaria prevention and treatment measures (UNICEF-WHO) 23. Prevalence and death rates associated with tuberculosis (WHO) 24. Proportion of tuberculosis cases detected and cured under DOTS (internationally recommended TB control strategy) (WHO) As can be seen from the graph to the right even though the overall number of people living with HIV is increasing, the actual number of new cases is decreasing, along with the number of AIDS deaths. However, the news is not all good, because in some regions like Eastern Europe and Central America the number of HIV infections is increasing.
The key to reducing HIV infection rates is to:
- Improve availability of condoms
- Improve knowledge of how HIV is transmitted
- Improve testing
- Ensure all blood for medical use is tested
- Reduce transmission between mother and baby
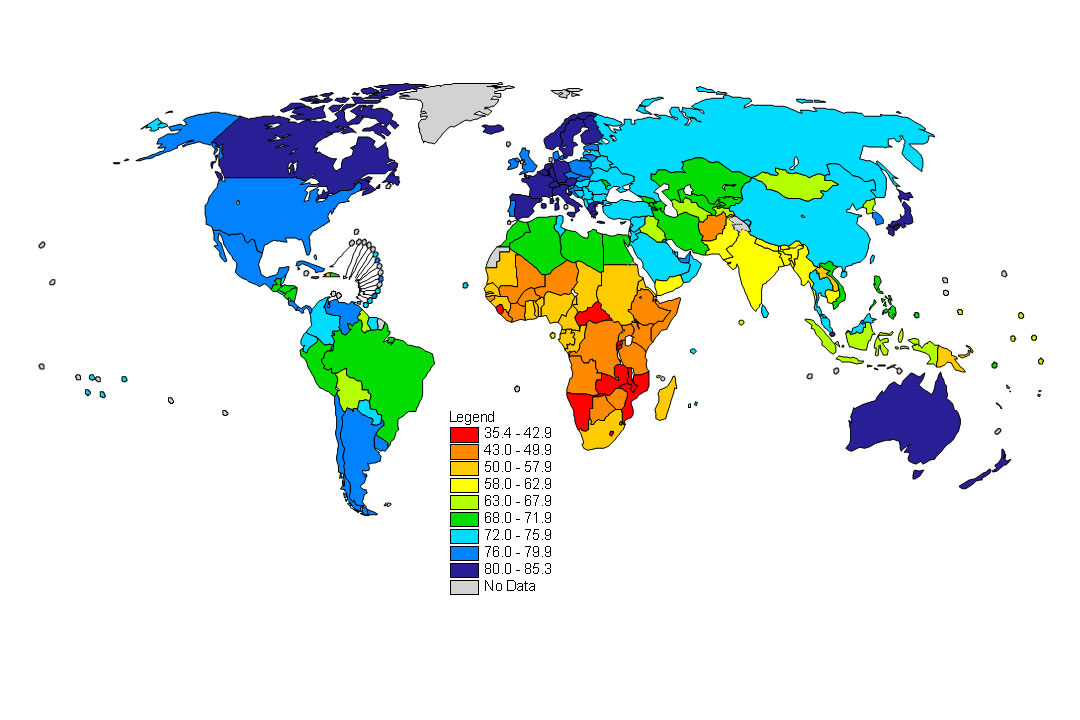
Life Expectancy
Life Expectancy is the average age people are expected to live to at birth. The world’s current average life expectancy is about 70 years, but there is a huge gap between the highest (Monaco at about 89 years) and the lowest (Angola at about 38 years). As can be seen from the graph to the right the world’s average life expectancy has increased by about 25 years in just over 50 years. The reasons for the increase in life expectancy include:
Life Expectancy is the average age people are expected to live to at birth. The world’s current average life expectancy is about 70 years, but there is a huge gap between the highest (Monaco at about 89 years) and the lowest (Angola at about 38 years). As can be seen from the graph to the right the world’s average life expectancy has increased by about 25 years in just over 50 years. The reasons for the increase in life expectancy include:
- Improved diet and increased food production
- Better provision of clean water
- Immunisation programmes to eliminate diseases like small pox and reduce others like TB
- Better medical care
- Improved post natal care (reduced infant and child mortality)
- Better education about diet, hygiene, etc.
- Prolonged civil war e.g. Sierra Leone
- Disease e.g. HIV in Botswana
- Famine and drought e.g. Ethiopia
Also with countries there can be very big differences in citizens life expectancies. The two maps to the right highlight this fact very clearly. The areas coloured red (light and dark) have the lowest life expectancies (between 70-78 for men and 70-80 for women) while the green areas have higher life expectancies (78+ for men and 80+ for women). From the map (especially the male map on the right) it is very obvious the people in Scotland, West Wales, Northern Ireland and some northern cities (Liverpool, Manchester, Leeds, Sheffield, Newcastle and Sunderland) don’t live as long as people from England and East Wales. The obvious reason for this would be health spending, but this is not true because the Scottish NHS spends more per capita than the English NHS. Research suggests that main reason is income, although other factors may have included:
- Smoking and drinking
- Dangerous jobs (fishermen, mining, oil drilling)
- Pollution, especially in northern industrial cities like Sunderland and Sheffield
- Distance from medical care.
- Diet (fruit and veg)
Education
Education is vital if countries want to reduce disparities, alleviate poverty and see an improvement in the standard of living. Education can be measured in numerous ways including:
Education is vital if countries want to reduce disparities, alleviate poverty and see an improvement in the standard of living. Education can be measured in numerous ways including:
- Adult literacy
- Percentage of university graduates
- Education spending
- Pupil teacher ratios
- Male female education equality
- Years of Schooling
- If people can read and write they are less likely to be exploited because they know what they are being asked to do and/or what to sign
- They understand the importance of family planning and can reduce fertility rates and birth rates
- They understand the importance of health, diet and medicine. They will know how to prevent diseases e.g. HIV and malaria, how to remain fit and healthy by eating a good diet and how to cure diseases when sick.
- They have a better chance of getting a higher paid job.
- They have a better chance of being independent and not relying on a husband/wife, their family, community or country.
- Some groups in some countries appose female education
- Some countries are at war and youngsters and teachers are forced to fight.
- Some countries cannot afford to provide free education for all.
- In many primary based countries children are needed to work on the land.
- In poorer countries children might have to contribute to family income, care for parents or look after the family home.
Income
Having a good income is important because it allows people to get an education for themselves and for their children, maintain a healthy diet and therefore stay fit and pay for a good house and services. In short it allows you to enjoy a positive cycle of wealth (completely opposite to the cycle of poverty in the last section). However, it must be remembered that we can’t simply look at people’s income and determine if they are wealthy or not. If we looking at the UK, the highest average income are going to be found in the SE. However, this is also the area where cost of living is most. Therefore, it might be better looking at people’s disposable income rather than their gross income.
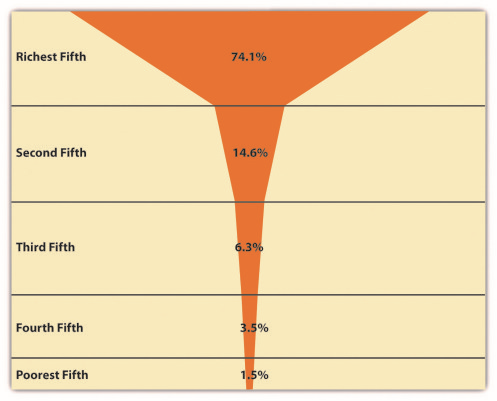
The diagram below right clearly shows that there is a massive gap between the rich and the poor, with the richest 5th controlling 74.1% of the world’s wealth and the bottom 5th controlling only 1.5%. However, even though the world is still very polarised in terms of income, many countries are seeing there national incomes increase and move towards converging with some of the bigger more developed countries. Countries like South Korea and more recently China, India, Vietnam and Indonesia are seeing rapid and prolonged growth in income.
It is also important to remember that even when countries experience growth in income it is very unlikely that this growth is universal. There will probably be groups that are marginalised creating inequalities.
Having a good income is important because it allows people to get an education for themselves and for their children, maintain a healthy diet and therefore stay fit and pay for a good house and services. In short it allows you to enjoy a positive cycle of wealth (completely opposite to the cycle of poverty in the last section). However, it must be remembered that we can’t simply look at people’s income and determine if they are wealthy or not. If we looking at the UK, the highest average income are going to be found in the SE. However, this is also the area where cost of living is most. Therefore, it might be better looking at people’s disposable income rather than their gross income.
The diagram below right clearly shows that there is a massive gap between the rich and the poor, with the richest 5th controlling 74.1% of the world’s wealth and the bottom 5th controlling only 1.5%. However, even though the world is still very polarised in terms of income, many countries are seeing there national incomes increase and move towards converging with some of the bigger more developed countries. Countries like South Korea and more recently China, India, Vietnam and Indonesia are seeing rapid and prolonged growth in income.
It is also important to remember that even when countries experience growth in income it is very unlikely that this growth is universal. There will probably be groups that are marginalised creating inequalities.
Reducing Disparities
Trade and Market Access
Many people argue that the best way to alleviate poverty and reduce disparities is to promote global trade. This argument has grown even stronger after the forces of Capitalism effectively defeated the ideas of Communism. However, despite improvements in transport and communication, global growth and a more culturally interconnected planet, many countries still struggle to trade freely. One of the biggest barriers to free and open trade is protectionist policies carried out by developed nations.
Trade: The exchange of goods and/or services. The exchange maybe for other goods and/or services but is normally for money.
Trading bloc: A group of countries who have joined together to promote trade. This might be through relaxing protectionist barriers or even having a common currency. Examples of trading blocs include the EU, NAFTA and ASEAN.
Exports: Goods and/or services produced within a country and then sold overseas.
Imports: Goods and/or services purchased overseas and brought into a country.
Embargo: The prohibition of trade with a particular country. An embargo might be a way of punishing a country or an attempt to force a country to change its policies. Probably the most famous embargo is the US embargo of Cuba.
Sanctions: Sanctions are restrictions placed on a country’s trading. For example after Kuwait was invaded by Iraq, Iraq was not allowed to buy any military goods or weapons. This sanction was enforced by the UN.
Protectionism: Attempts to protect domestic markets by making foreign goods less competitive. This is most commonly done through tariffs and quotas placed on foreign goods and subsidies given to domestic goods.
Tariffs: Tax/duties placed on imported products to make them more expensive and reduce demand for them.
Quotas: A limit placed on foreign goods to reduce the supply of them, therefore forcing the price up reducing the demand for them.
Subsidies: Financial help given to companies to make their production costs less. This might be through grants, or the reduction of taxes, relaxed planning control or below marked price electricity and water. The aim of subsidies is to make products cheaper and to protect them from overseas competition.
Free trade: When trade is totally free and fair – there are no protectionist policies in place. It is the aim of the WTO to promote free trade around the world.
WTO: The World Trade Organisation is an organisation aimed at protecting free global trade. It replaced GATT in 1995 and has 153 members. To join the WTO you have to demonstrate how your country promotes and practices free trade.
Fair trade: Fair trade does not produce goods itself, but instead lends its labels to companies that treat suppliers, host communities and the environment fairly and sustainably.
Balance of trade surplus: When the value of your exports is greater than the value of your imports.
Balance of trade deficit: When the value of your imports is greater than the value of your exports.
FDI: Foreign direct investment is money invested in a foreign country by TNCs or other countries.
TNC: A transnational corporation is a company that operates in multiple countries.
Microcredit: Small loans that are given to people that normally struggle to get credit from normal banks. The pioneers of micro-credit was Grameen Bank in Bangladesh
Free trade zones (Export processing zones or Enterprise zones): A zone or area where tariffs and quotas maybe wavered, taxes lowered, planning relaxed and bureaucracy eased to try and encourage investment and FDI.
Case Study Cuba (embargo)
The US should lift sanctions on Cuba as a prelude to dropping its “immoral” trade embargo against the island, Amnesty International has urged.US President Barack Obama has until 14 September to decide whether or not to extend the Trading with the Enemy Act, under which sanctions are imposed. The embargo is preventing Cubans from accessing life-saving medicine, says Amnesty Secretary General Irene Khan. The US began its embargo in 1960, tightening it two years later. This was largely as a result of Cuba’s alliance with the then Soviet Union. Mr Obama has insisted that the trade ban will stay in place until Cuba frees political prisoners and improves human rights.
Benefits of Free Trade:
Disadvantages of Free Trade:
- Gives local companies a chance to become global companies (TNC) e.g. Pollo Campero
- Countries who participate in free trade grow faster
- Protectionism makes products more expensive and may stop normal citizens from buying them e.g. cars in El Salvador are very expensive because of import duties
- Local companies can create pollution just as much as TNCs and may not have the money to clean up accidents e.g. BP created a huge spill but had the finances to clean up
- Mexico has increased its exports since joining NAFTA
- Trading can improve relationships between countries
- Countries with trading relationships are less likely to go to war
- Jobs are created for local workers
- Workers may improve skill and education level
- Infrastructure like roads and ports are improved for the whole country
- Laws can be put in place to protect worker rights
- More money can be made by selling to external markets rather than just domestic market
- Residents have access to greater variety of products
- Companies will become more competitive and should actually lower prices
- It is hard for countries to be self-sufficient because they may lack fertile soils or fossil fuels – they need to trade to survive and grow
Disadvantages of Free Trade:
- TNCs may take over local producers e.g. Walmart moving into El Salvador and taking over local supermarkets
- Workers are often exploited by TNCs and paid low wages for long hours
- Countries may become dependent on foreign countries imports e.g. Europe relies on Russian gas
- Countries may become reliant on foreign workers e.g. UAE rely on European, South Asian and Filipino workers
- Producing locally should reduce transport costs and certainly reduce air miles
- Local companies will use more appropriate technology and take greater care of the environment
- The most skilled jobs will be taken by foreign workers and may lead to unemployment
- Much of the profits will go overseas e.g. economic leakage e.g. Hiper Piaz profits go back to Walmart in US
- TNCS often don’t care about the environment of other countries and may cause pollution e.g. Union Carbide in Bhopal, India
- Fast food franchises like Starbucks and Burger King may cause local traditional restaurants to close
- Fast food restaurants may worsen people’s diets
- TNCs may close factories during economic recessions leading to unemployment
- Countries may be forced to change policies to suit TNCs e.g. lower taxes.
The European Union
Banana Wars
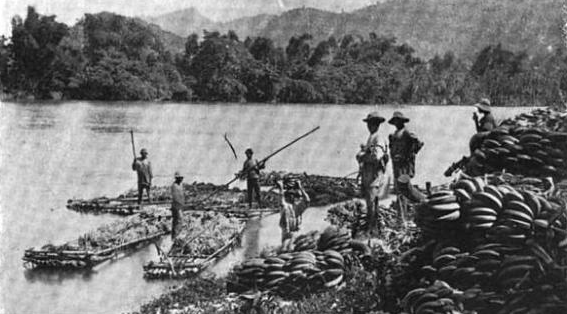
Bananas are one of the world’s most popular fruits with 5.4 million tonnes of them eaten in Europe in 2008. Bananas are a tropical fruit and general grown by countries in the Caribbean, Central America, West Africa and parts of SE Asia. Since 1975 Europe gave Caribbean countries and a couple of other former colonies generous import quotas of bananas free from tariffs. The idea was to support former colonies and reduce the need for aid, by promoting trade. However, by favouring certain countries it made Latin American bananas more expensive because they had to pay tariffs despite the fact they should be cheaper to produce on larger plantations dominated by US TNCs (Dole, Chiquita and Del Monte). Not everyone was happy about this, especially countries like Germany who had lost all its former colonies, but were still paying too much for smaller Caribbean bananas.Because of the EUs hypocritical approach to free trade protests were made by the US and Latin American producers to the WTO. After years of failed negotiations a deal was finally struck in 2009 that would begin the slow reduction of tariffs on bananas. The agreement may hurt some Caribbean and African producers, but should see banana prices fall by up to 12% for European consumers.